Rides is a small web app, plus an iOS companion app, that replaces my use of Strava. It shows every ride I have recorded since 2014 on one map, with a heatmap, filters, statistics, ride details, elevation corrections and lift detection. I built it with Claude Code, as a hands-on way to find out how far agentic coding has come.
Why replace Strava
I have been using Strava to record all my rides since 2014. For a long time, my phone was recording straight to Strava. During the last 5 years, I have been using an Apple Watch to record the rides to Apple Health as cycling workouts, then imported into Strava.
A prominent feature of Strava is that its users can define trail/road segments, and compete on them. If your ride is publicly shared, you compete with the whole world (split by gender, only 2 genders). You get a Top 10, culminating in a KOM/QOM: King/Queen of Mountain. If your ride is private, you only compete against yourself. I have defined a bunch of segments, especially during my time in Lausanne (2018–2021).
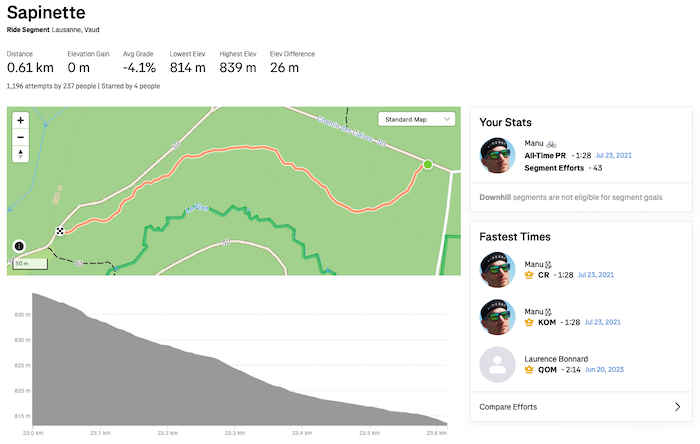
I named a pretty flat segment that I liked because it is slaloming between conifers “Sapinette”, as a callback to Flav’s homemade pine tree flavored liquor. I still hold the KOM, most likely only because it’s not a popular segment.
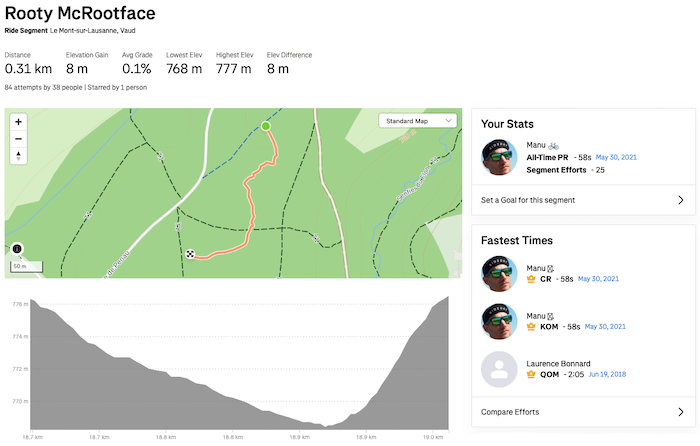
Another segment I named “Rooty McRootface“ because of Boaty McBoatface. I also still hold the KOM, probably for the same reason as on Sapinette.
And I have played the game of trying to improve segment times, both publicly and privately.
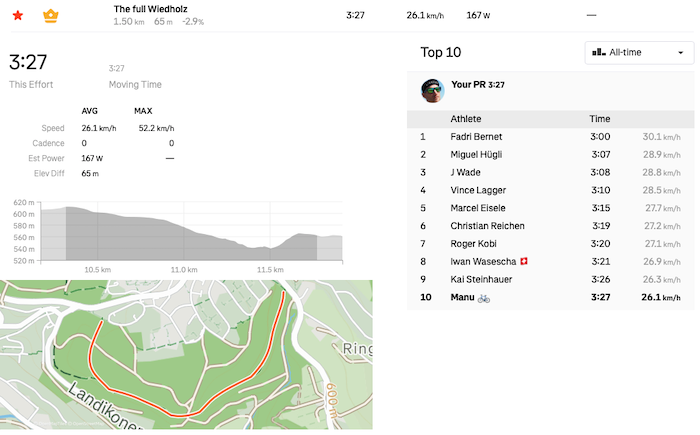
I used to ride the segment named “The full Wiedholz“ a lot during my hardtail years in Zurich, and really wanted to get the KOM. I did on 22.09.2017, and am still barely in the Top 10 now.
Leiterli, a.k.a. “Uetliberg ridge singletrack descent”, is still my favorite downhill trail in Zurich. One afternoon in March 2017 I decided to tackle it with my DH bike instead of my hardtail, with the goal of getting the KOM. And I did! It is a very popular segment though, and I’m not even in the Top 10 anymore.
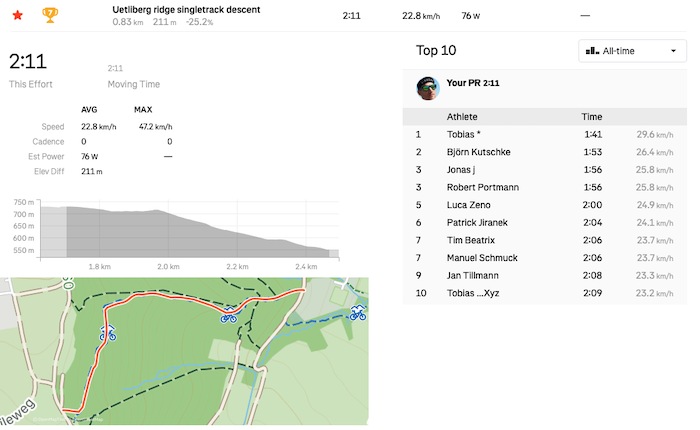
A couple of days after I got the KOM on Leiterli, the dethroned king reclaimed the first place 😅
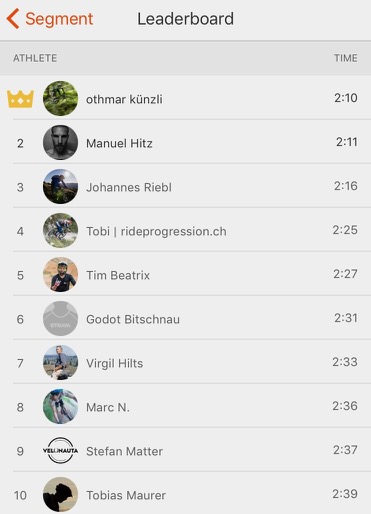
I very recently got a Top 10 on my favorite descent in my home region, Gruyère.
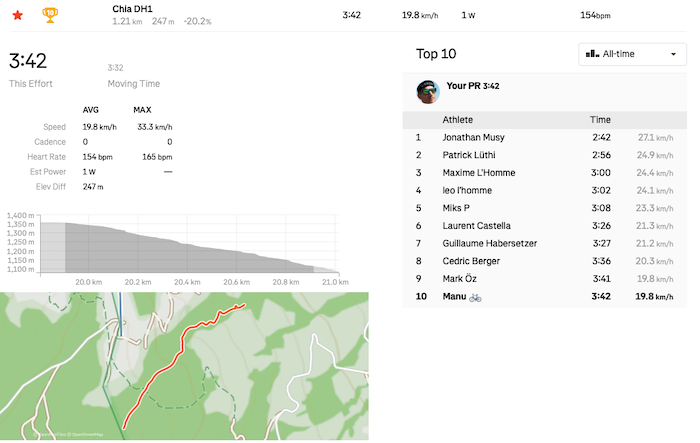
Overall, I have been a happy user of the free version of the app. For a while though, some things have bothered me about Strava:
- because it tracks your times on user-defined segments, I tend to ride more dangerously on sections of rides I enjoy and know I could be good at. When mountain biking, it usually means taking dumb risks on downhill trails. On the gravel bike, it can mean taking unnecessary risks at road intersections, for example.
- following other people on the platform feels like stalking, even if the other party obviously is in control of what they disclose. (The privacy settings in Strava are decent.)
- the free version lacks features I really crave, and I’m not sure the paid version has all of these: 1) a heatmap of all or a selection of rides, 2) go to a location on the map and see rides done by me nearby, 3) the exact stats I am interested in, no more, no less (e.g. for my yearly year-in-review posts)
I have been thinking about creating a small web app that could replace my usage of Strava, getting rid of all the bloat I don’t care about, and implementing the handful of features I actually want. So, after finally using Claude Code again for a coding assignment I had to do for a job application, I realized how much progress agentic coding has made in the last months. It gave me the necessary little nudge of motivation to start building my Strava replacement.
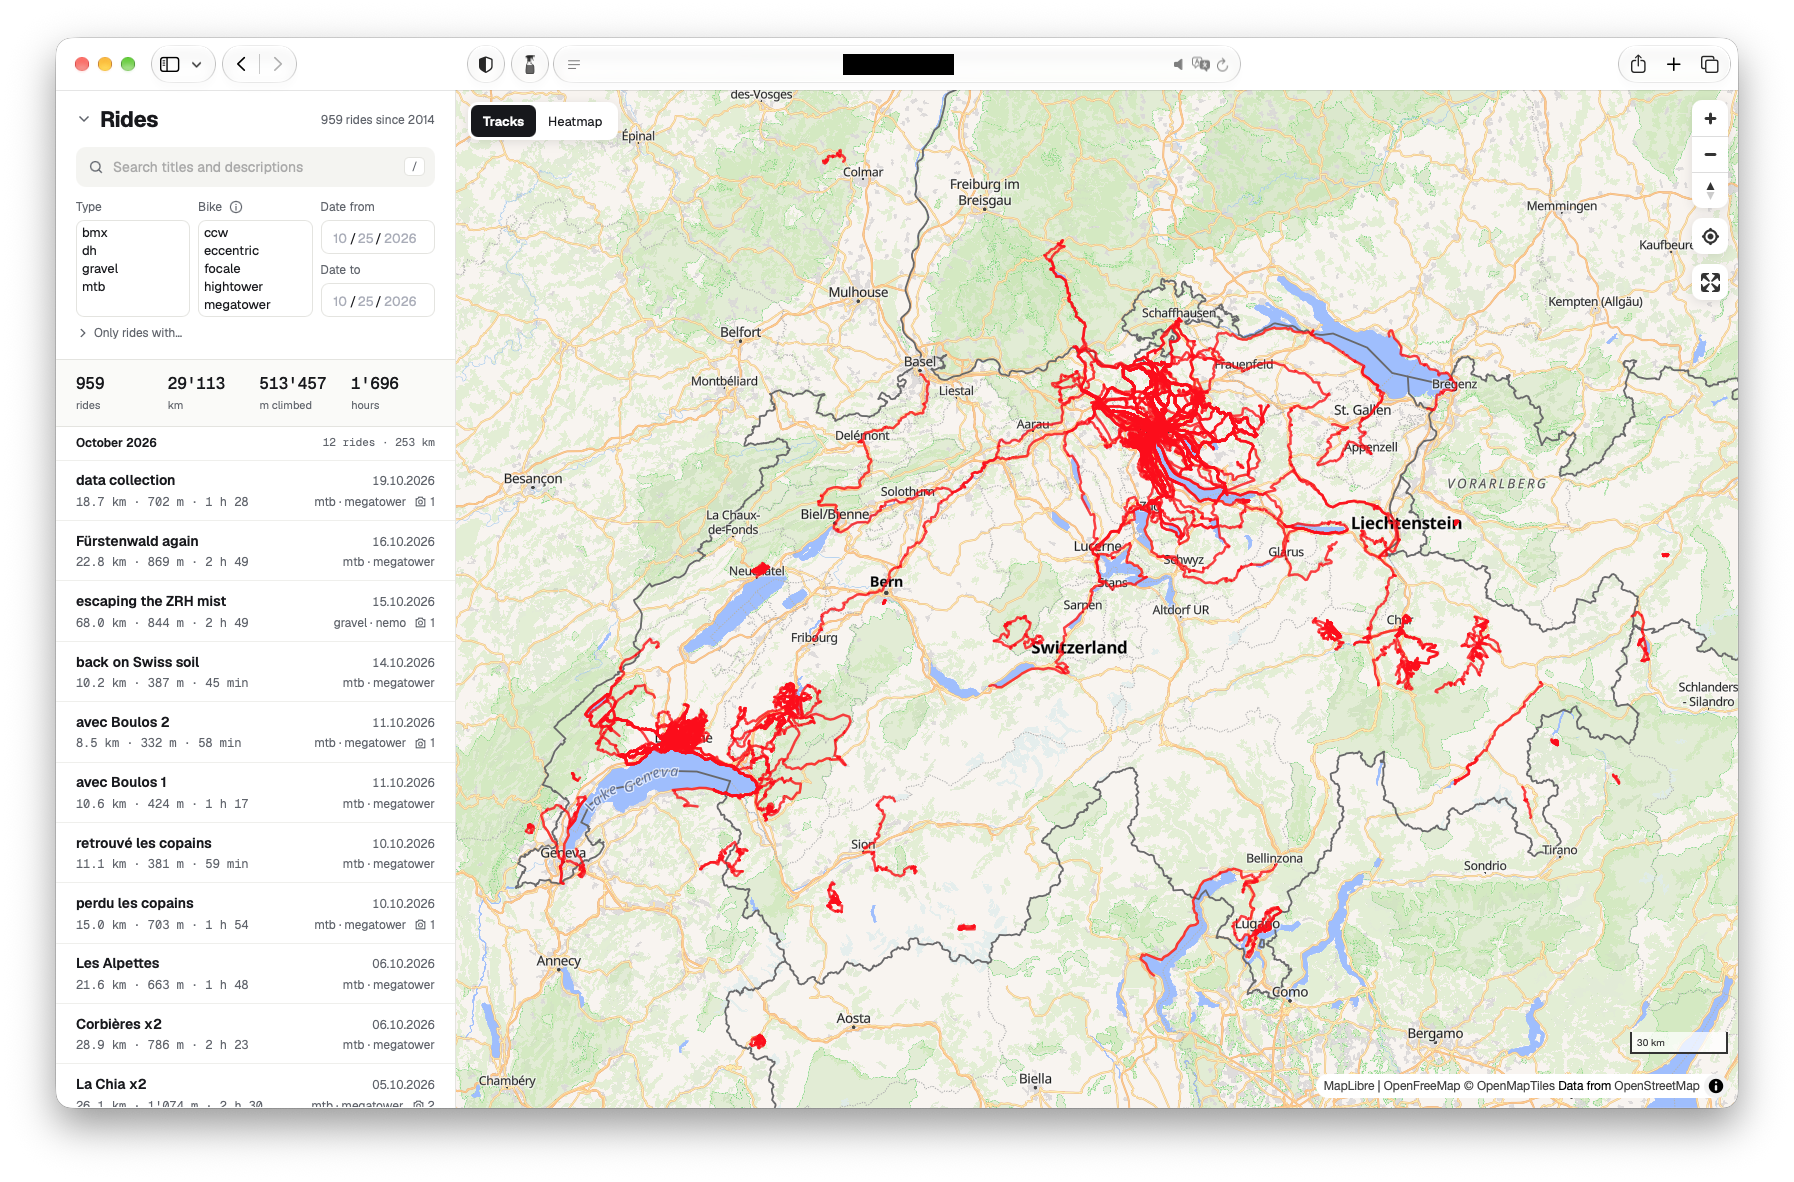
Features
I wanted to keep the app as simple as possible, while still having all the features I came to like on Strava, and the ones Strava could not provide.
Everything is built around the map
By default, the app shows multiple rides at once on the map. Every ride can be selected on the map to view its details.
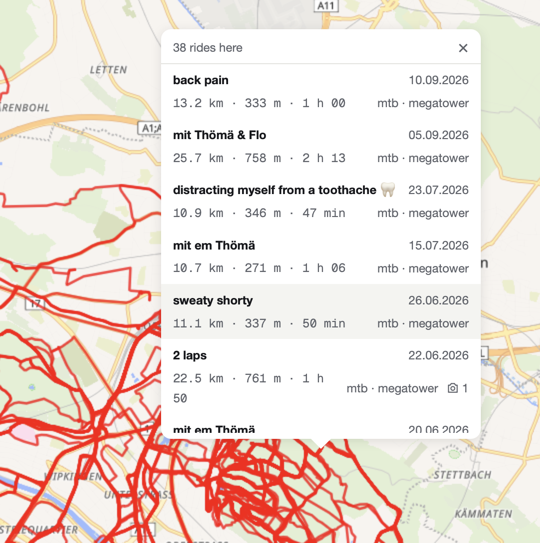
When a track is clicked on the map, and there are several rides going through that location, a popup lists those rides for selection:
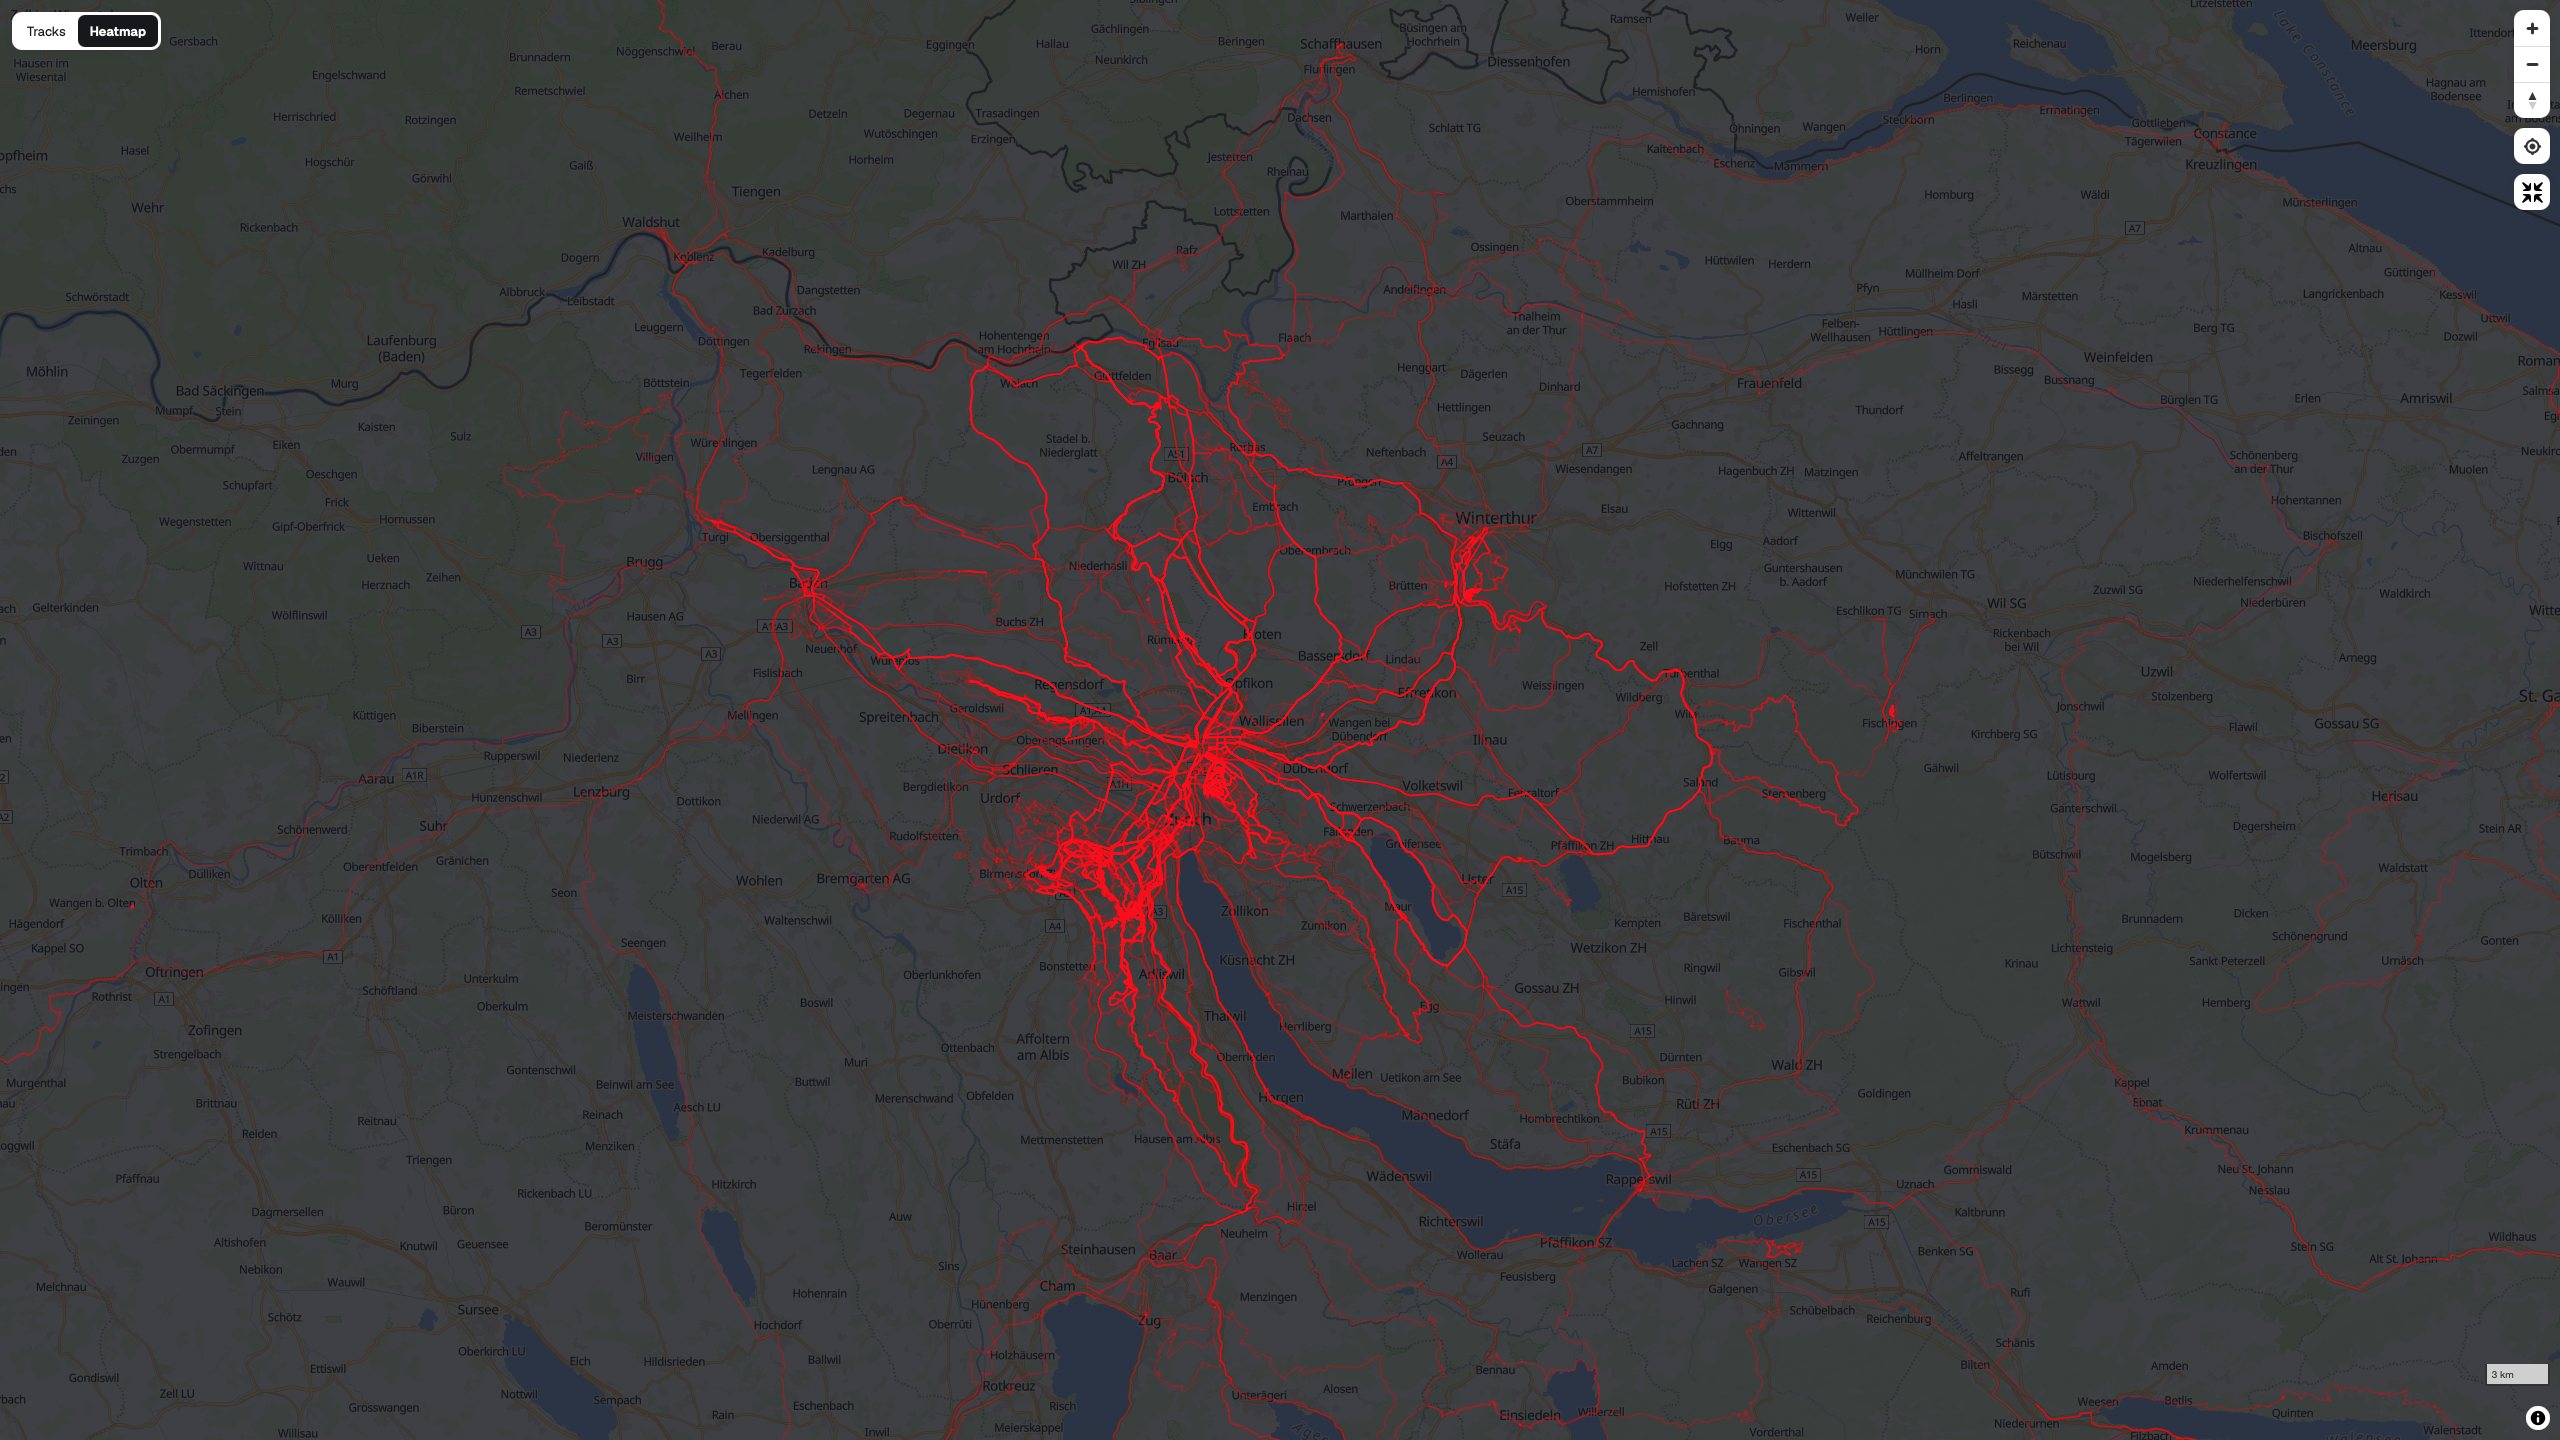
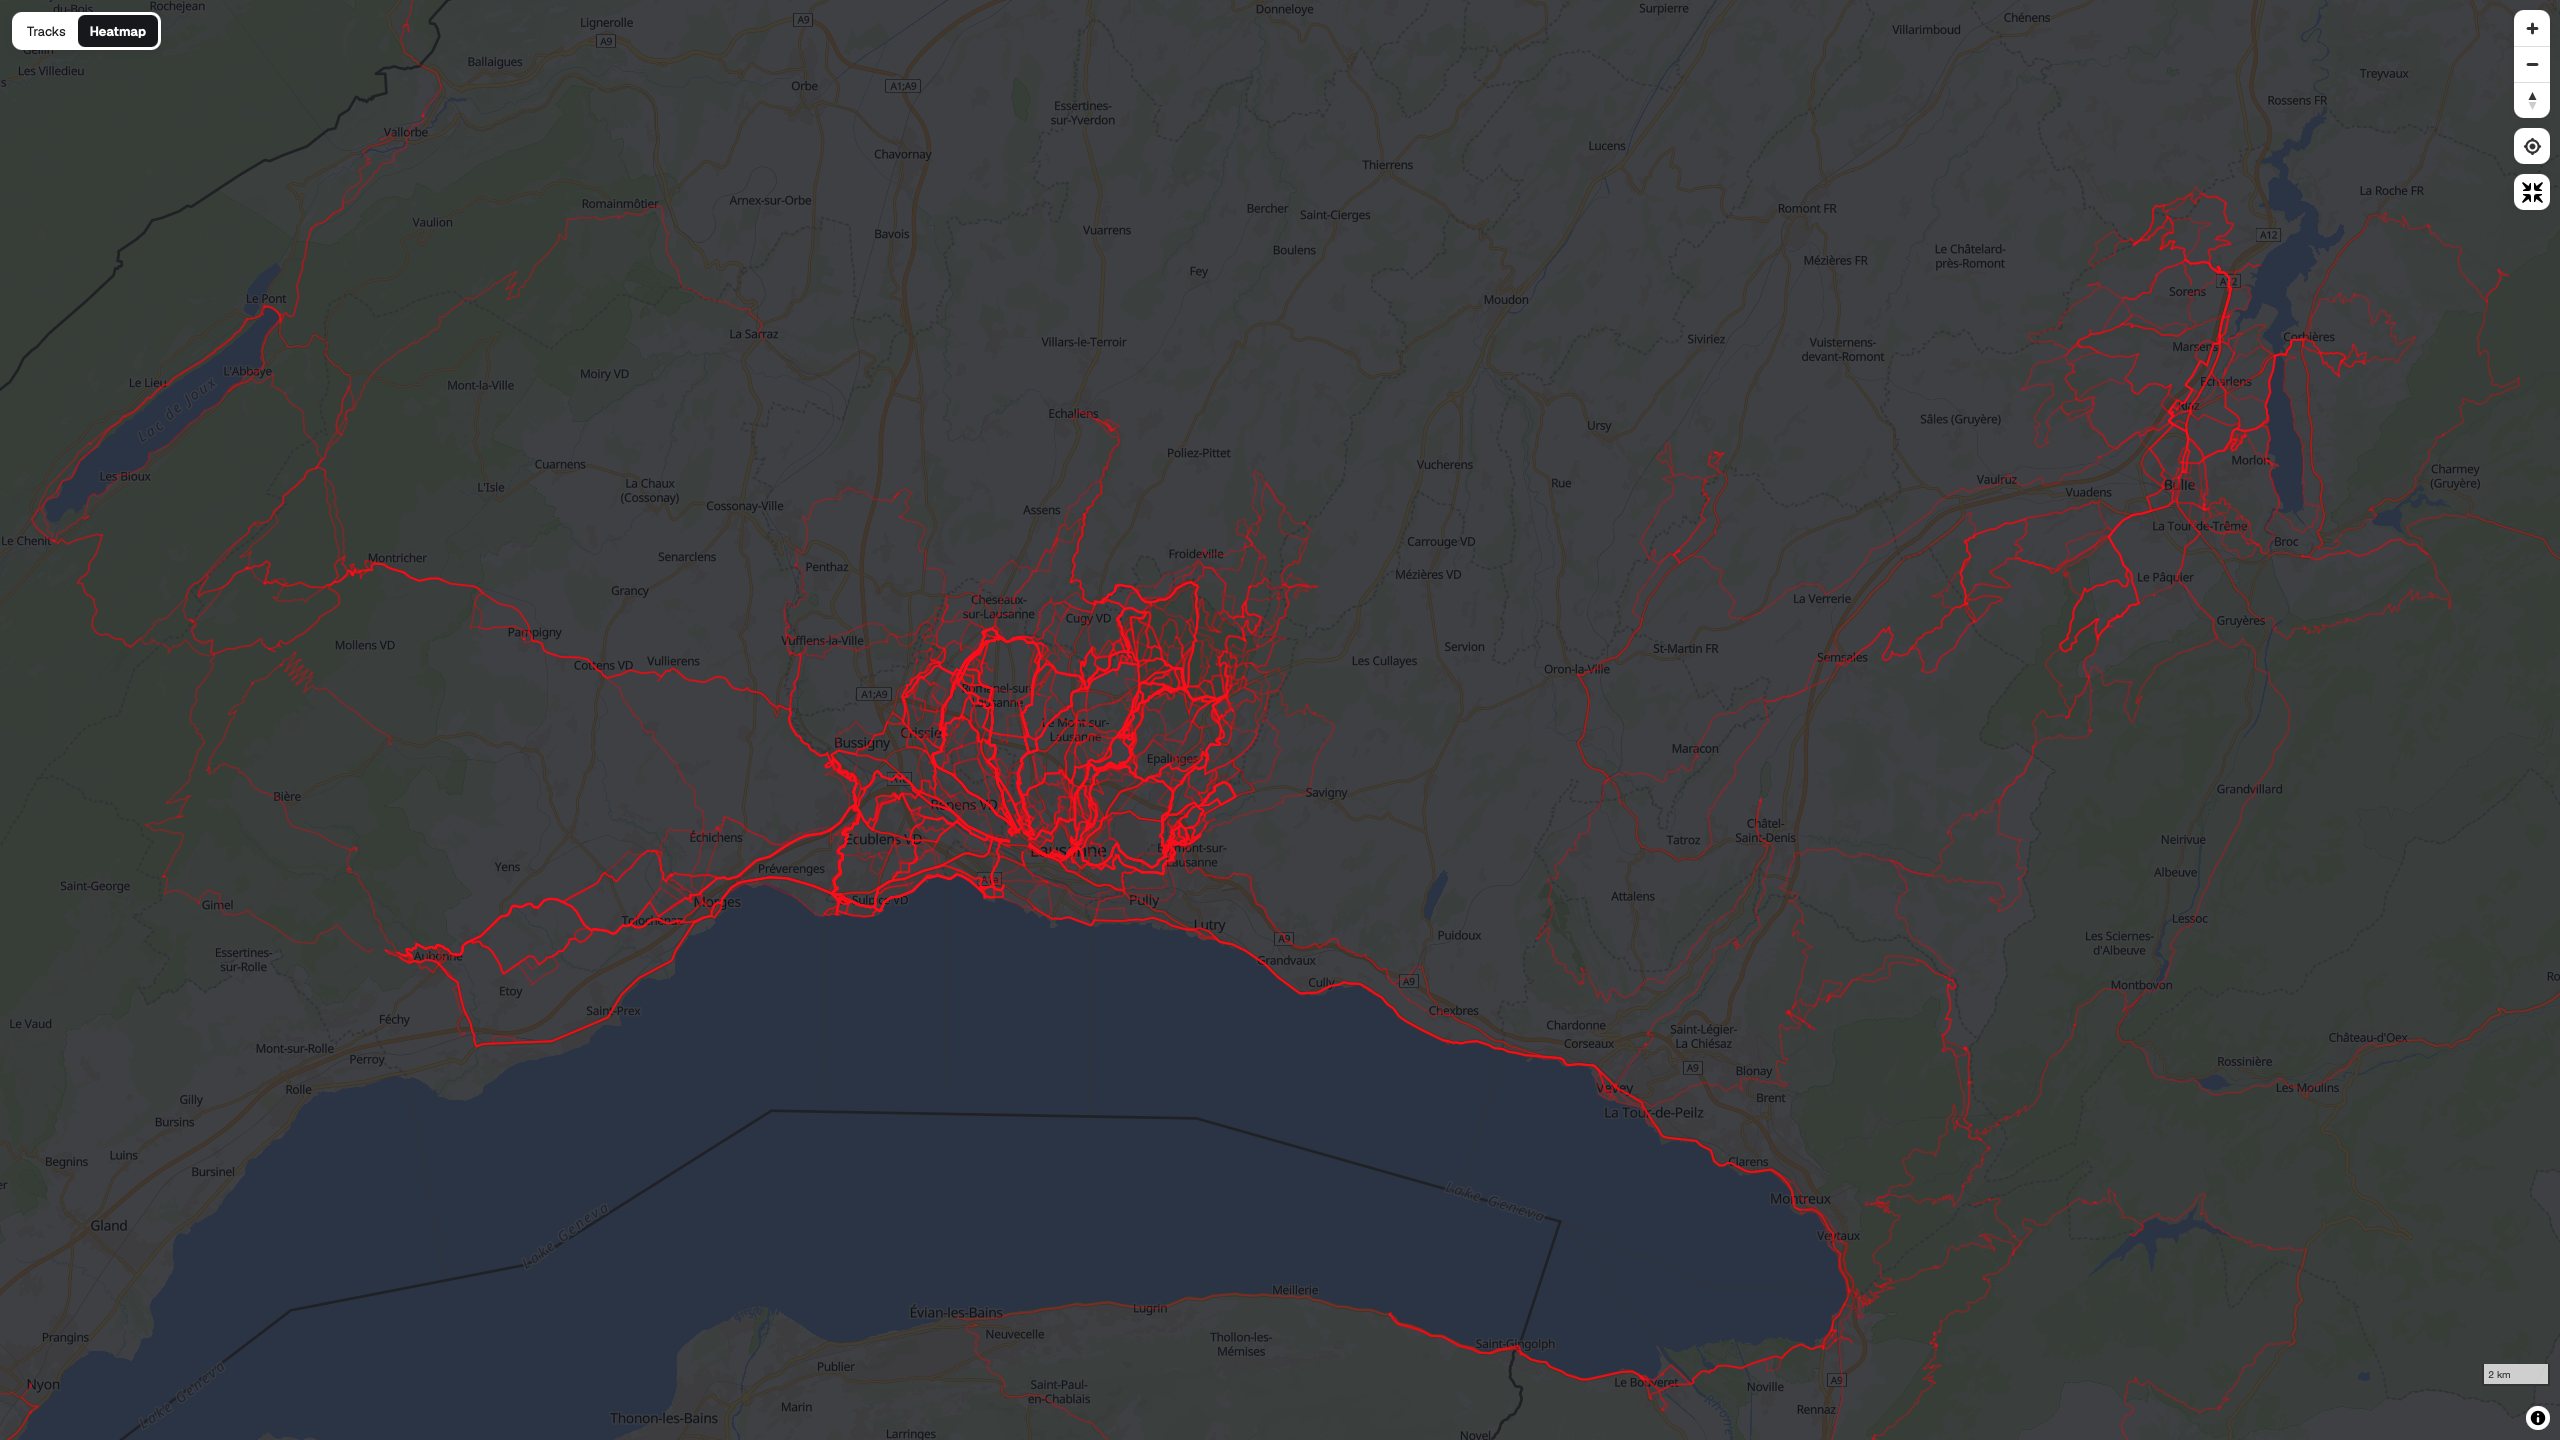
One of the features I really wanted to have, and that was super easy to implement, is a heatmap: lighter lines on the map are ridden less often, darker/brighter lines are traveled more frequently.
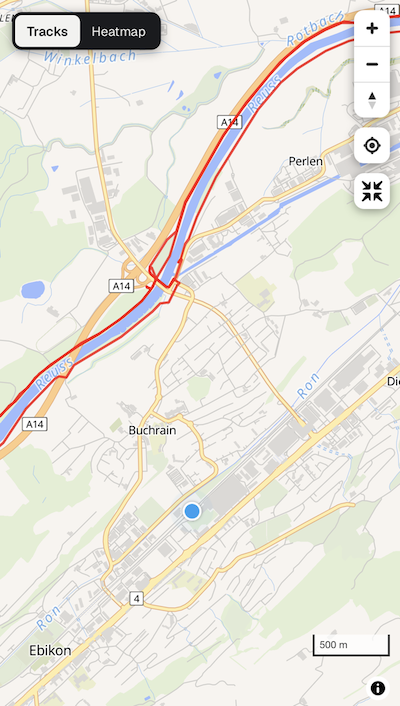
The map can be centered around the current location. This is most useful on the phone, while out in the wild, when you’re not sure anymore where exactly that nice trail you’ve already ridden in the past is:
Filtering and searching rides
The basics I wanted:
- searching in the title and description of a ride, ignoring case and diacritics (meaning, for example, searching for “baaahnle” would find “Bääähnle”)
- filter by ride type. Selecting a ride type then shows only the bikes of that type in the bike filter
- filter by bike
- provide a date range. The “Date from” cannot be before the earliest recorded ride (January 2014). And “Date from” must be before “Date to”
- since the ride importing mechanism detects lift rides (typically in bikeparks), there is a filter to show only rides with lifts
- be able to show only rides with media (pictures or videos)
- show only rides that got their elevation profile corrected by looking elevation up on a map, instead of relying on my Apple Watch’s faulty barometer
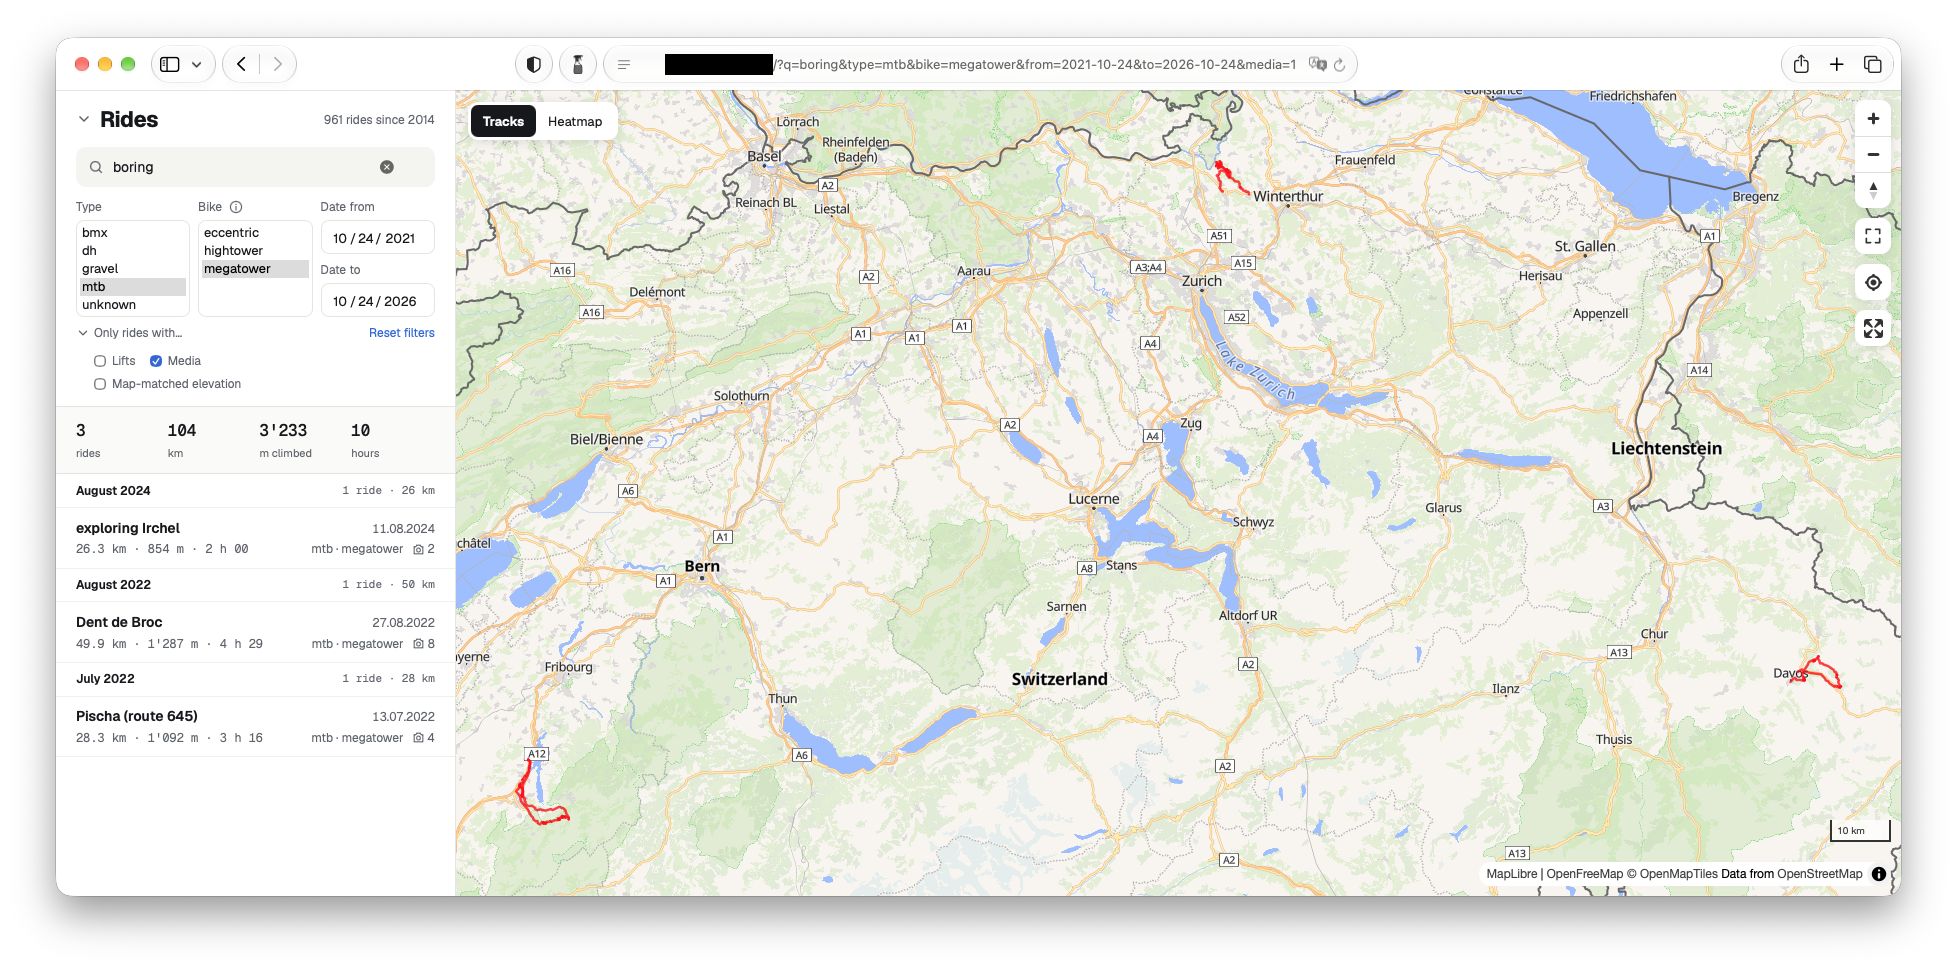
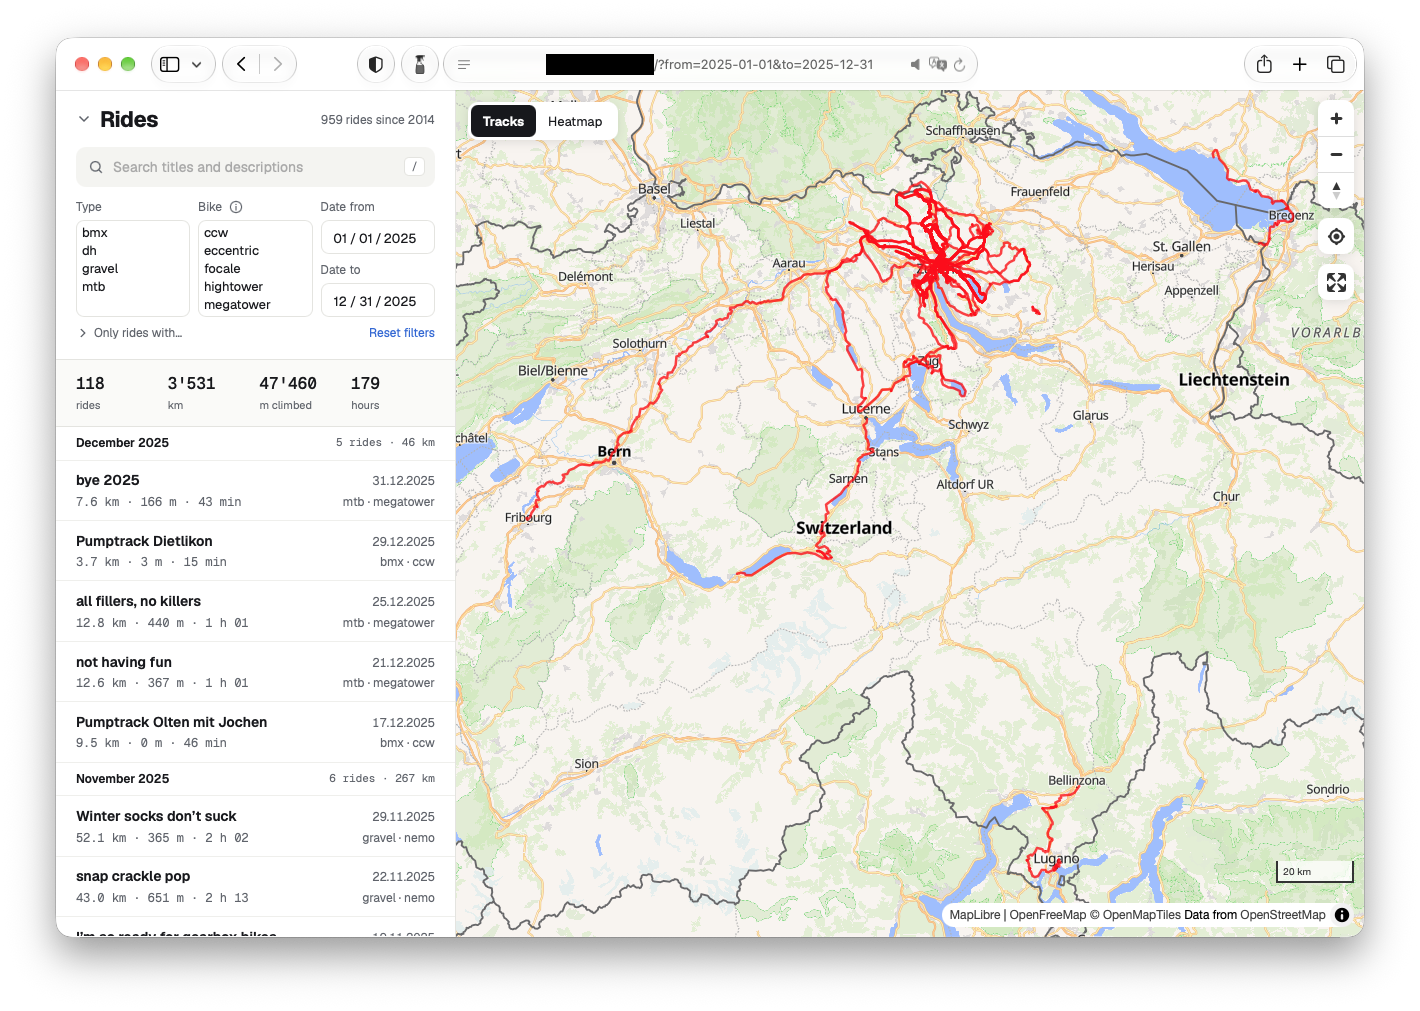
As you can see in the screenshot, the search query and the filters are in the URL, so it can be shared. For example, ?q=Rico lists the rides with Rico, and ?bike=nemo the rides with my Cinelli gravel bike.
Statistics
Whether you are filtering or not, there is always a summary of the number of rides, total distance, total elevation and riding hours displayed:

If you click on the i next to the “Bike” filter, a popup shows displaying the same stats, but broken down by bike:
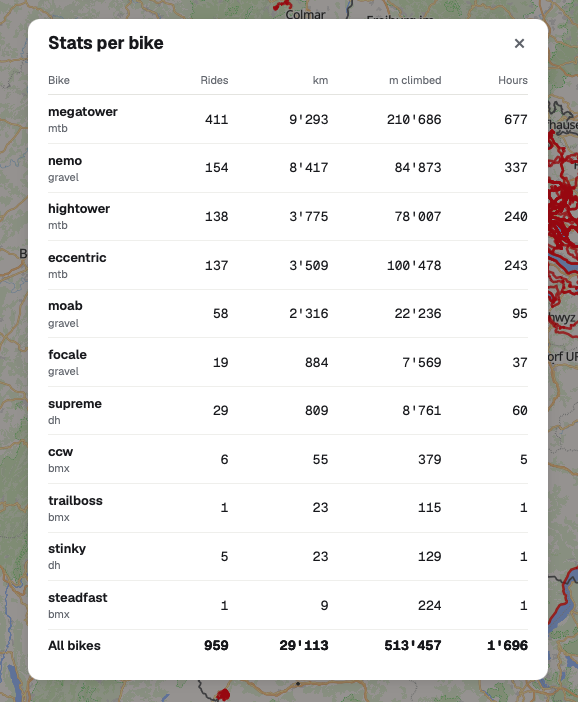
The riding stats in my year-in-review posts used to include some manual calculations because Strava would not provide the stats by bike type (mtb, gravel, etc.). Now I can simply use the ”Type”, “Date from”, “Date to” filters, and even get a split by bike model. Lovely.
Ride details
When a ride is selected in the list of rides, or its track is clicked on the map, you see the full details:
- the track on the map is colored with shades of red to indicate the grade in 5% increments. Darker is steeper, both uphill and downhill.
- the date and time of the start of the ride
- the total riding distance
- the elevation gain
- the elevation loss
- the total moving time
- the total recording time
- the bike model used
- the type of ride: mtb, gravel (and road), dh, bmx
- the average and max speeds
- the average and max heart rate
- the average power
- the calories burnt
- the count of lift rides
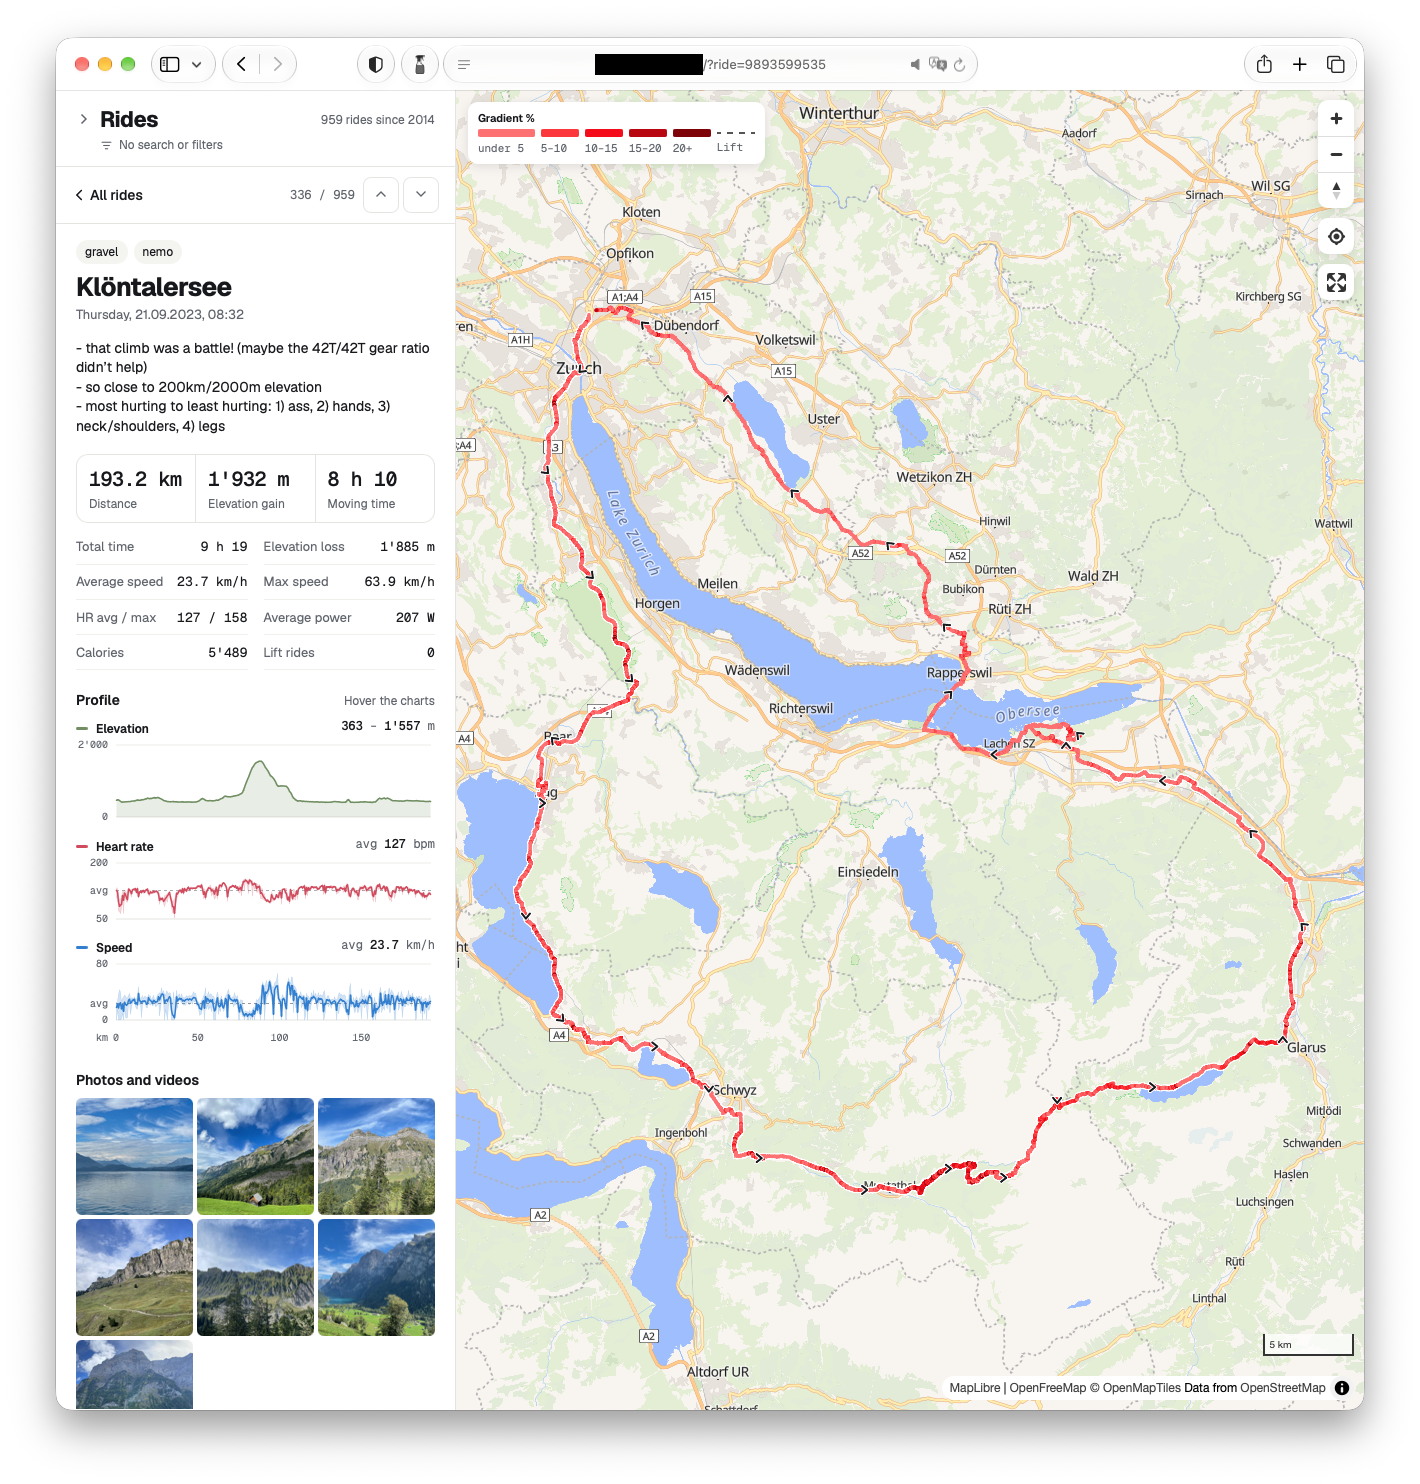
Most data come from the recording device: initially, my iPhone running the Strava app; then my Apple Watch directly, via Apple Health workouts. The Apple Watch does not provide elevation loss, but it can easily be derived from the elevation data. It also does not provide power data, whereas Strava gives an estimate. The bike model and ride type is manually added to each ride. The count of lift rides is something I added because neither Strava nor Apple Health workouts are able to detect them and ignore those elevation gains in the ride’s total. More on the topic of lift rides and elevation profiles later.
There are 3 graphs with the riding distance on the x axis that show:
- the elevation profile in meters
- the heart rate in beats per minute (bpm)
- the speed in km/h
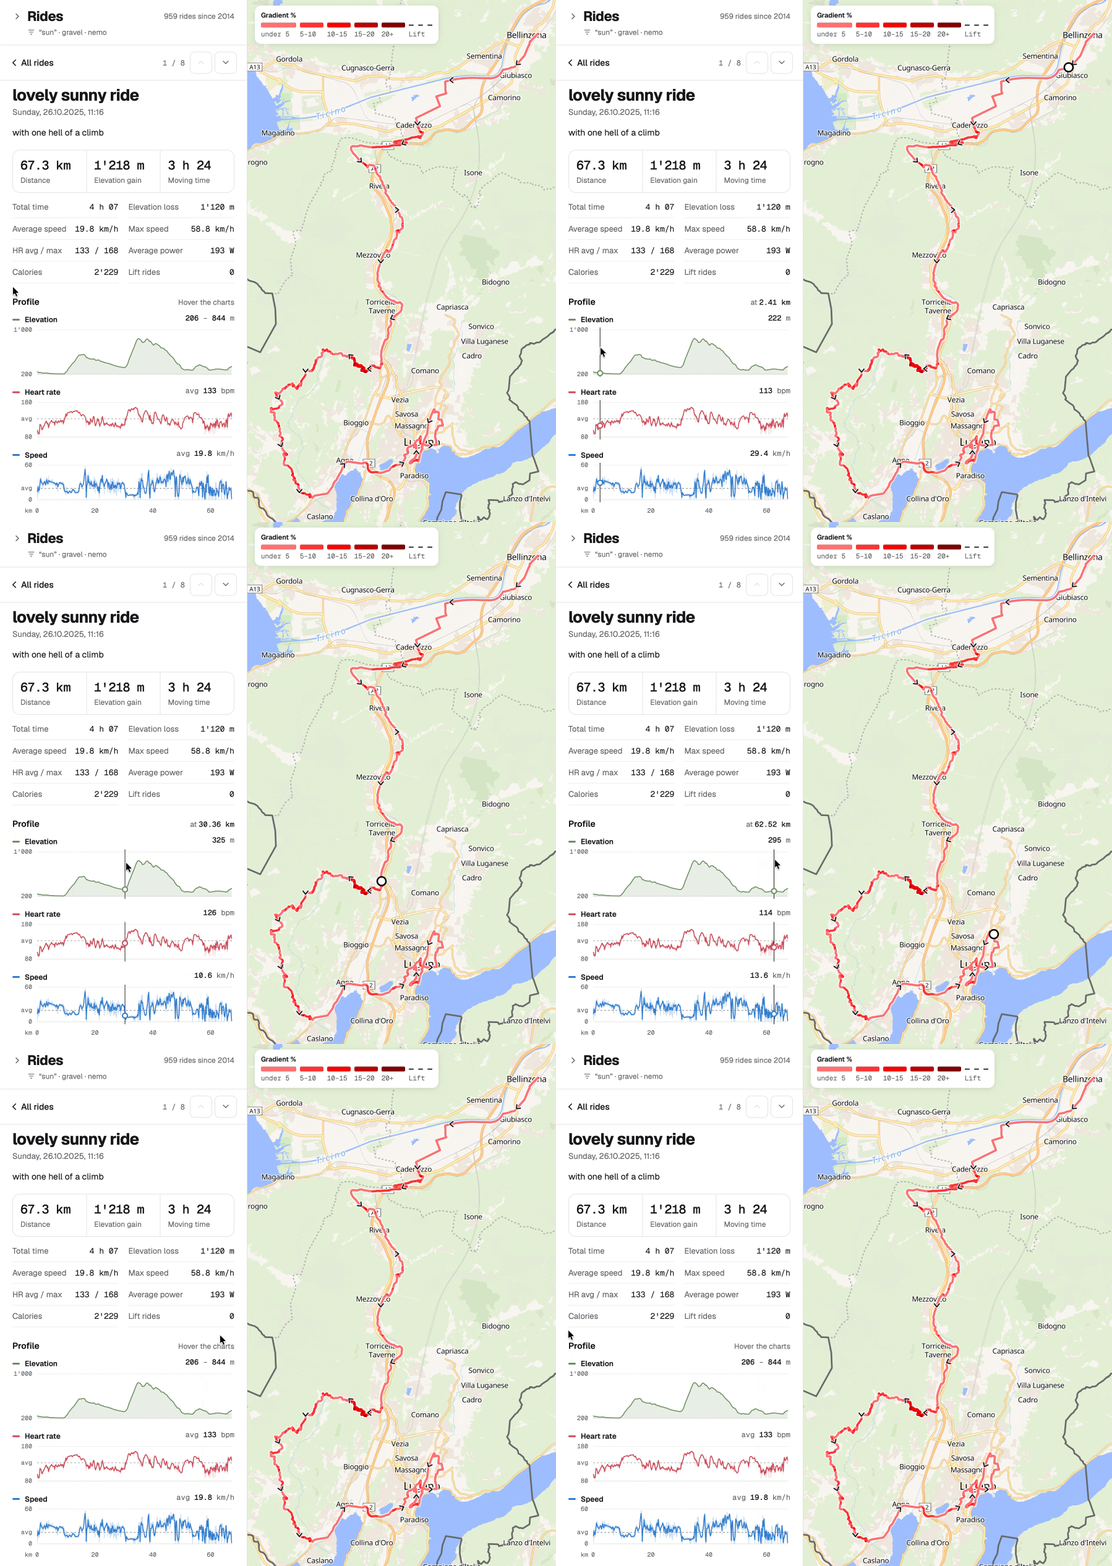
When you hover over the graph, a vertical bar and a dot shows the current position in all 3 graphs, and a traveling dot is shown on the map:
Finally, the ride’s pictures and videos are listed in a grid. When clicked, a media is shown in fullscreen, with the caption below it, if there is any.
Mobile friendly
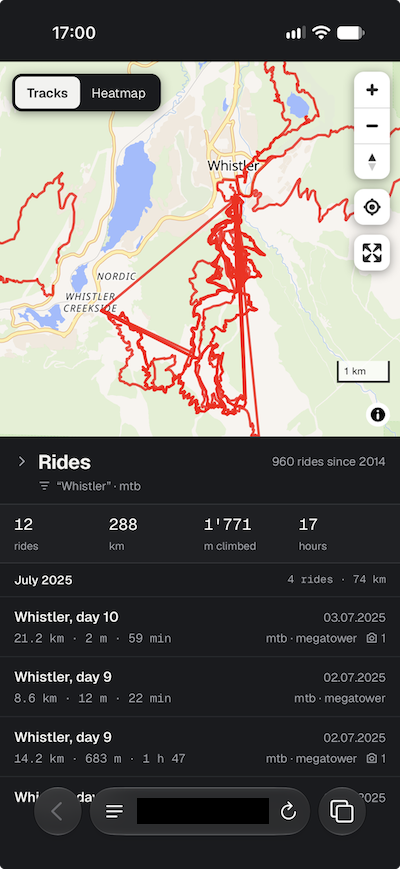
Of course, the app also works on a mobile. I chose to keep all the features, but simply collapse the search/filter section by default on smaller screens. A summary shows what search or filters are currently applied.
Elevation corrections
When I started this little project, I was not expecting the data recorded by the watch to be so bad. It turns out, the barometer can recalibrate mid-ride, or drift, or misinterpret some pressure changes as altitude changes. I noticed it in 2025 and this year, and Strava gives the option to use location-based elevation data. I was not entirely sure how I could approach the problem, so I brainstormed with Claude Code. It suggested to use the free Copernicus GLO-30 global digital elevation model. After it implemented a first version of elevation correction, I asked for some stats of rides that have been corrected, or not. I manually went through many rides and told Claude Code the ones that still have unexpected elevation spikes, which helped to improve the elevation correction algorithm. The rules that follow all make sense I think, but the fact that they are only generalizations of issues found in a bunch of real rides does not make me confident that all cases are covered. And I have to admit that I haven’t given it much thought.
Lift ride detection
While I was going through elevation corrections with Claude Code, I got side-tracked with lift detection. There’s something that has always bothered me with Strava: during bikepark days, so when you take lifts/gondolas/funiculars to go up, and mostly only ride down, Strava would count the elevation gain from the lift ride. What I usually ended up doing is pause the recording when getting on the lift, and resuming when at the top. But of course, this was prone to mistakes. I always thought that detecting lift rides should be fairly simple: it’s a straight line, climbing lots of elevation in an impossibly short time, usually over unrideable terrain. Like for the elevation correction, I let Claude Code come up with some heuristic by giving it a list of rides and the expected number of detected lift rides. Here’s Claude Code’s explanation:
Importing and exporting rides
My plan was to first export all the data from Strava then import it into my app. Once this worked, I would stop using Strava, and import individual rides directly from Apple Health as they were completed. This means that the code dealing with the ride import has to be able to parse 2 different data sources. It reads some data directly from the export (e.g. date/time of ride, media files), it does elevation corrections and lift ride detection, and generates a simplified track displayed when all rides are shown. One feature I copied from Strava is the exclusion of privacy areas at the beginning and end of rides, to make it slightly harder to figure out where I live(d). This also needs to be done during the import, so none of the displayed data contains locations in the privacy area.
If I want to get rid of Strava, I need a way to get the cycling workouts recorded by my Apple Watch to appear in my Rides web app. The workouts are stored in Apple Health. Apple however offers no way to export one or several workouts. It only allows to export all health data (steps, sleep tracking, etc.) at once, which takes forever. Shortcuts does not work either for that use case. The only solution is to create a small companion app for the phone, and give it access to health data (just like Strava). Claude Code obviously helped me with that, because I have no experience in iOS development.
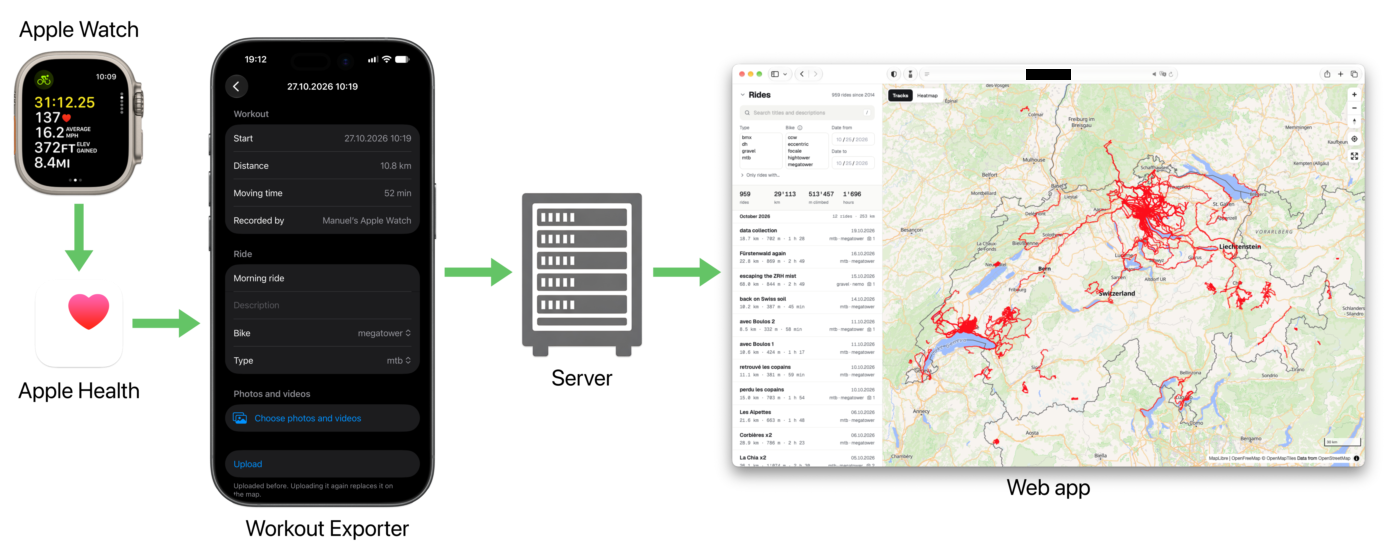
The Workout Exporter app simply:
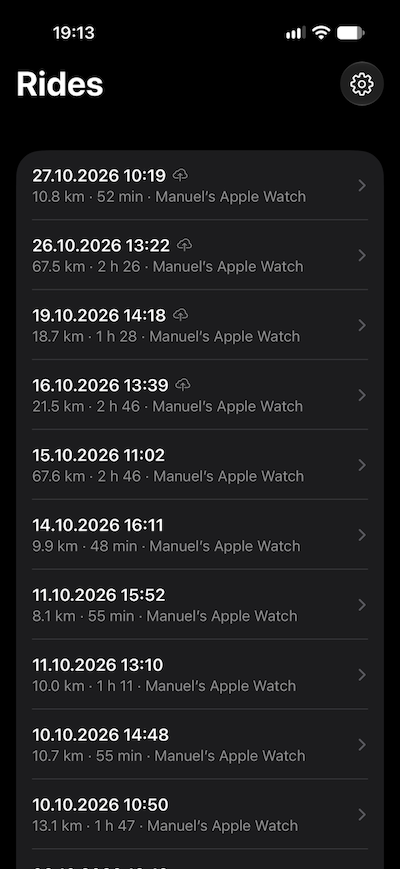
- lists all cycling workouts
- allows to view the details of a workout
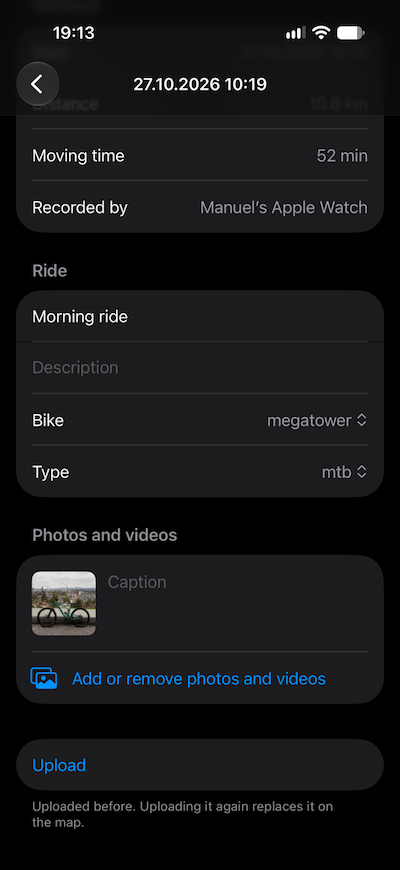
- add a title and description
- pick a bike model and ride type
- optionally select photos or videos from the camera roll with captions
- upload the ride to the server
The server then goes through the aforementioned process to import the ride. It provides a way for the Workout Exporter to display the work in progress, because for example downloading the digital elevation model for the elevation corrections might take time on the server. Any ride can be re-exported any number of times, and will simply overwrite what was previously exported.
Coding with AI
After playing a bit with AI-assisted development at work about a year ago, and not being convinced much, I have to admit that the progress since has been staggering. For this little web app and iOS companion app, the coding agents were spot on most of the time. I used Claude Code with Opus 5.5 with medium effort on a 200$ yearly Pro plan I reluctantly paid for in March, after a coding assignment I did for a job application required AI-assisted coding.
Methodology
I haven’t read anything about agentic coding, and have been a bit more hands-on. That’s probably something to improve on. In any case, my methodology so far has been to ask the AI to set up the project (providing library names, technologies, languages…), and then:
- describe a feature relatively precisely, with some technical guidelines in domains I’m familiar with
- when I’m really not sure about how it should be implemented, ask the AI for possible options, with drawbacks on each option
- check the generated code. Look for obvious shortcomings, security issues, exposed files/configuration…
- manually test the feature
- give the AI the ok to commit the code
- repeat
Once I have the basic functionality (a.k.a. an MVP):
- ask the AI to write comprehensive unit tests
- again, manually check that the tests make business sense; that they’re not purely for good code coverage
- ask the AI to refactor parts of the code where I see possible improvements. Also ask the AI where it would see improvements to be done
When the code looks solid and is well tested:
- ask the AI to do a design review, with my own inputs for usability, accessibility, screen size requirements, etc.
- implement new features. This time, making sure new tests are added, and existing tests are not broken
I have played with describing features with more or less details, and have been surprised with how well Claude Code has been dealing with my poorly specified features.
Features I did not ask for
Many times, Claude Code has been suggesting, or sometimes (annoyingly) straight up implementing, features or details I have not asked for:
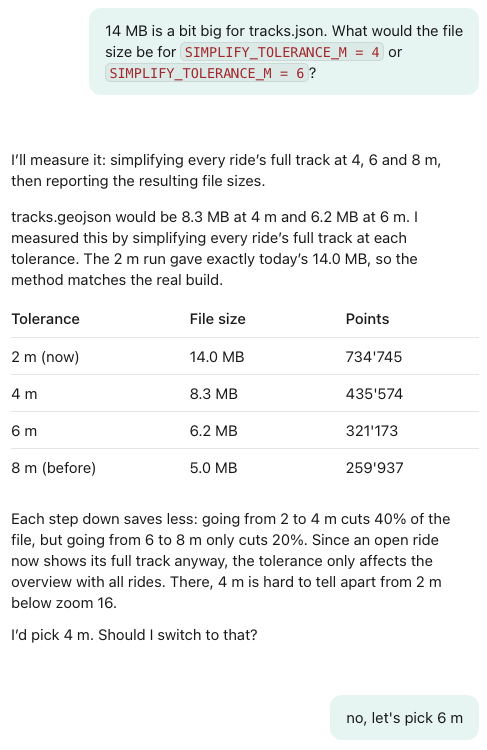
- Already in the first implementation on the app, the AI chose to simplify the tracks with the Douglas-Peucker algorithm, which I had never heard of. It made sense, but I made the AI make the track simplification less aggressive (by asking it to compare the data size with several levels of simplification), and to only apply it when several rides are shown, so not when viewing ride details.
- I wanted to add the hovering over the profile graphs (see the animation above) at some stage, but the AI implemented it in the first iteration of the profile graphs without me ever mentioning it. Pretty cool!
- The whole web app was built responsive (= it works on all screen sizes, from mobile to desktop) without me asking for it. There were some screen overflow bugs that only showed up on an actual mobile device, that couldn’t be simulated by the AI by simply resizing a desktop browser.
- I struggled to find useful information in the Infomaniak support pages about any potential restrictions that the backend of my app could encounter: memory, process running time caps, file upload size limits, etc. So the AI suggested it provides a probe app that tests the various points, telling me what to run and to paste the results back in the Claude Code thread. Pretty clever!
- I specified the API to implement for the iOS companion app to call, but it didn’t occur to me that it could be useful to have an endpoint to poll for processing updates after a new set of rides are uploaded to the server. The AI suggested it, and implemented the backend and frontend.
- The AI chose to add the “/” keyboard shortcut to start a search. It’s a nice little extra I wouldn’t have thought of adding.
- The lightbox-style implementation of the media viewer was completely Claude Code’s doing.
- One thing I noticed is that the AI has a tendency to slightly over-engineer. When I asked it to make the bike and ride type filters multi-selection instead of single-selection, it went ahead and implemented a custom component with a dropdown instead of using native HTML multi-selection (arguably a bit uglier, but more concise)
Small frontend dev details I learned from AI
I kinda promised myself to read all the code the AI produced. But I miserably failed. The backend first was implemented in Python because that’s what the AI picked, and it was an excuse for me not to look too closely at the code, not knowing the language much. Then I realized that my hosting provider doesn’t offer Python servers, so I made the AI rewrite the whole backend in Typescript on Node. And I still haven’t read it completely. In some of the parts I did read, I lost patience trying to understand the code, and asked the AI to explain it with schemas and examples, which are the 2 embedded explanations you see further up in this page. At first my reason for wanting to read the AI’s code was mistrust, but after seeing the quality, it’s more to learn from it. That’s for the backend/server part. The same goes for the companion app. I have no experience in iOS app development. While the first iteration of the app (listing rides, and generating a zip to download) was fairly straightforward and understandable for a beginner, the final product with API calls and unit tests is quite more complex. For the web app however, I read all the code because I knew I would understand it, and could potentially learn some neat tricks.
So here are some examples of small frontend details I learned from the AI.
- I knew about the dialog HTML element, but never implemented a popup from scratch with it. It’s surprisingly straightforward:
<dialog … aria-labelledby="…">
    …
    <form method="dialog"><button … aria-label="Close">×</button></form>
    …
</dialog>
dialog::backdrop {
    background: rgba(0, 0, 0, 0.4);
}
- I didn’t know about matchMedia() that is a much better way than user-agent sniffing to have code execute on mobile only:
// the search and filters take too much room on a phone: start with them closed
if (matchMedia("(max-width: 700px)").matches) filterSection.open = false;
- It never occurred to me to use fetch to load a local JSON file. I usually just paste the JSON in the HTML. The downside is that you need a local server for it to work (in other words, accessing index.html via file:// won’t work):
fetch("rides.json", { cache: "no-cache" })
- Adding invisible but clickable wide lines on the map to make the thin tracks easier to click:
map.addSource("tracks", { type: "geojson", data: tracks });
map.addLayer({
    id: "tracks",
    type: "line",
    source: "tracks",
    …
    paint: { "line-color": TRACK_COLOR, "line-opacity": 0.75, … },
});
…
// invisible wide lines to make thin tracks easy to click
map.addLayer({
    id: "tracks-click-area",
    type: "line",
    source: "tracks",
    paint: { "line-width": 14, "line-opacity": 0 },
});
…
map.on("click", "tracks-click-area", (event) => { … });
- I knew about this hack to get rid of diacritical marks (e.g. to transform “enchaîné” into “enchaine”). But the AI chose to use the weird looking /[̀-ͯ]/ regular expression instead of ̀-ͯ:
const normalizeForSearch = (text) => text.normalize("NFD").replace(/[̀-ͯ]/g, "").toLowerCase();
- I never thought about this hack of using an attribute to hide elements:
<div id="gradient-legend" class="map-legend" hidden></div>
[hidden] {
    display: none !important;
}
- A smart use of selectors to hide the keyboard shortcut hint in the search input:
#search:focus ~ kbd,
#search:not(:placeholder-shown) ~ kbd {
    display: none;
}
- Using the accent-color CSS property (not supported on Chrome) to change the color of checkbox inputs.
- Using the place-items CSS property as a shorthand for align-items and justify-items.
- Using Array.prototype.fill() to create arrays programmatically.
Final thoughts
I must admit that AI-assisted coding has come a long way in the last couple of months. I’m impressed. This whole project is not rocket science, but there were enough unknowns (the iOS app development), unexpected developments (all the elevation corrections due to faulty data) and small details here and there that it would probably have taken me about 10x as much time if I did it on my own. Working with Claude Code feels like being helped by a smarter (seemingly) and way way faster colleague. What I also noticed is that the AI has a tendency to over-engineer features. I’m not sure yet if my approach is good: maybe I’m slicing up the work too much, maybe I’m detailing the specifications too much, maybe I have not detailed the non-functional requirements enough (hence the over-engineering)? I will have to experiment a bit more. I also want to try local LLMs for coding, but my M2 MacBook Air with 24GB of RAM might be a bit weak.
On a higher level, despite being truly impressed by the result in this project, I’m still not convinced that the turn this whole AI thing has taken really was something we needed. Especially considering the resources and staggering amounts of money poured into datacenter construction, the cannibalization of the computer hardware production, the shameless copyright violations perpetrated to train the language models, etc. And all of it being dictated by a handful of companies and their lunatic billionaire CEOs.
Weird times. But at least I can always go for a nice bike ride whenever I feel like it, and then see its track on the map.